Amazon VPC Lattice is a fully managed application networking service that you use to connect, secure, and monitor the services and resources for your application
VPC Lattice, you should be familiar with its key components.
Service
service can run on EC2 instances or ECS/EKS/Fargate containers, or as Lambda functions, within an account or a virtual private cloud (VPC). A VPC Lattice service has the following components: target groups, listeners, and rules.
Resource
Amazon Relational Database Service (Amazon RDS) database, an Amazon EC2 instance, an application endpoint, a domain-name target, or an IP address.
Resource gateway
A resource gateway is a point of ingress into the VPC in which resources reside.
Resource configuration
A resource configuration is a logical object that represents either a single resource or a group of resources. A resource can be an IP address, a domain-name target, or an Amazon RDS database.
Service network
A client can be in a VPC that is associated with the service network. Clients and services that are associated with the same service network can communicate with each other
Service directory
A central registry of all VPC Lattice services that you own or are shared with your account through AWS RAM.
Auth policies
create a policy for how a payment service running on an auto scaling group of EC2 instances should interact with a billing service running in AWS Lambda.
Auth-policies are not supported on resource configurations. Auth policies of a service-network are not applicable to resource configurations in the service network.
Features of VPC Lattice
You need not be concerned about overlapping IP addresses between VPCs.
As the traffic is internal between VPCs, you do not need to modify the route table.
Here we go with the usecase - i have hosted 2 web server on 2 instance and make use of vpc lattice
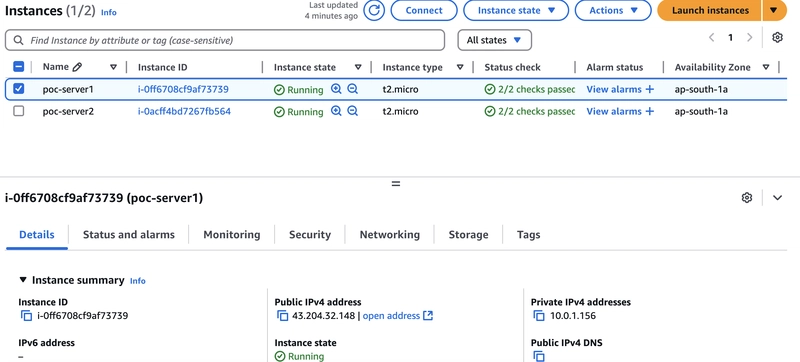
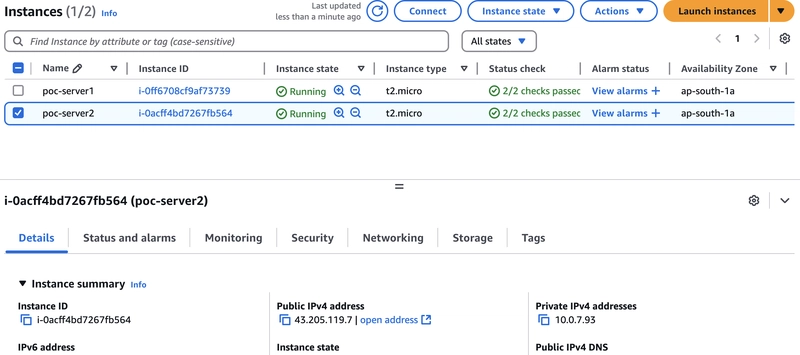
I have created 2 linux EC2-instance as webserver "poc-server1","poc-server2"
Both have seperate vpc and security groups to access the port from 80 using http.
Here are the servers
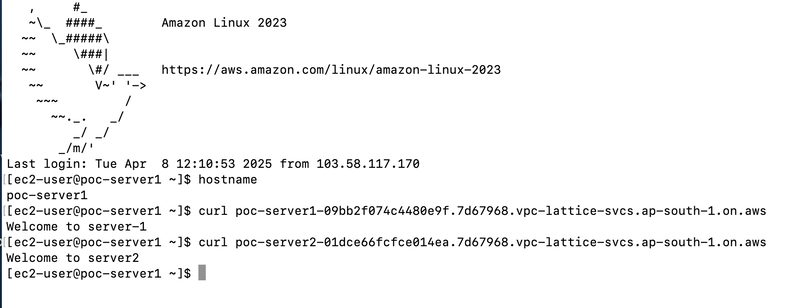
poc-server1
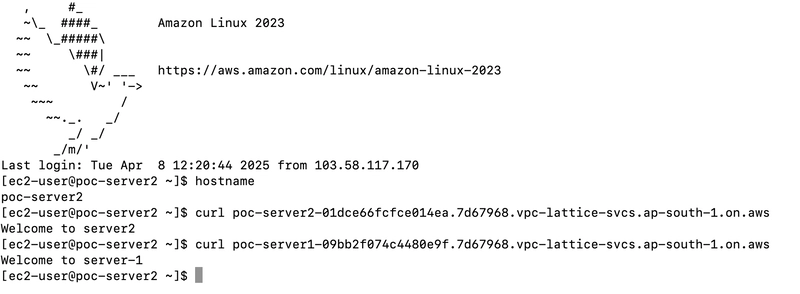
poc-server2
request from local machine to verify the web server
VPC lattice connection between the webservers
Go to VPC dashboard
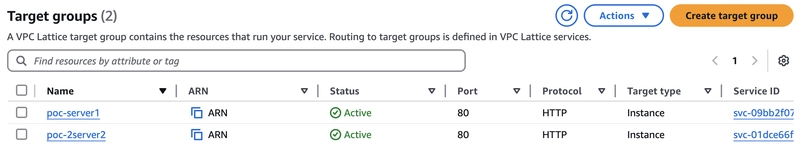
Click “Target groups” under the VPC Lattice section of the VPC Console.
Click “Create target group“.
Create the target group by instance type,protocol and VPC add the poc-server1 to the target group.
Follow the same steps for the poc-server2.
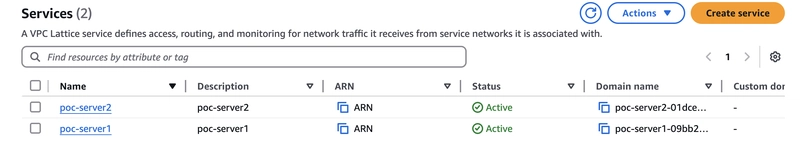
Under the VPC Lattice section, click “Services”
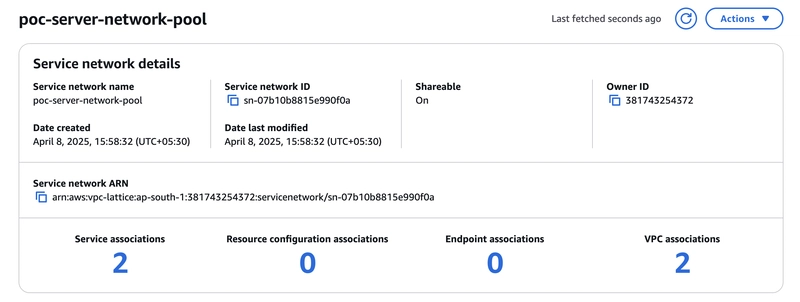
Need to create lattice service to associate the service with service network.
create vpc lattice service.
Click “Next”.
Click “Next” on the next page (the Define routing page).
Click “Next” on the next page (the Create network associations page).
Click “Create VPC Lattice Service” on the next page (the Review and create page).
Follow the same steps for the poc-server2.
VPC Console and click “Service networks” under the VPC Lattice section
Click “Create service network”. Create a service network
Under service association attach the services which we created as "poc-server1","poc-server2".
Under VPC association attach the VPC and security group which we created for the web servers.
Click “Create service network”
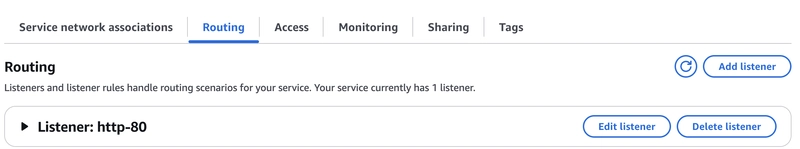
Go to the "poc-server1" service overview and Click “Routing”
Click “Add listener”
Follow the same steps for the service "poc-server2".
Return to the payment-svc overview and copy the domain name
VPC Lattice configurations have been completed. Let’s see how the setup works
Try to access the VPC Lattice domains from the EC2 instances
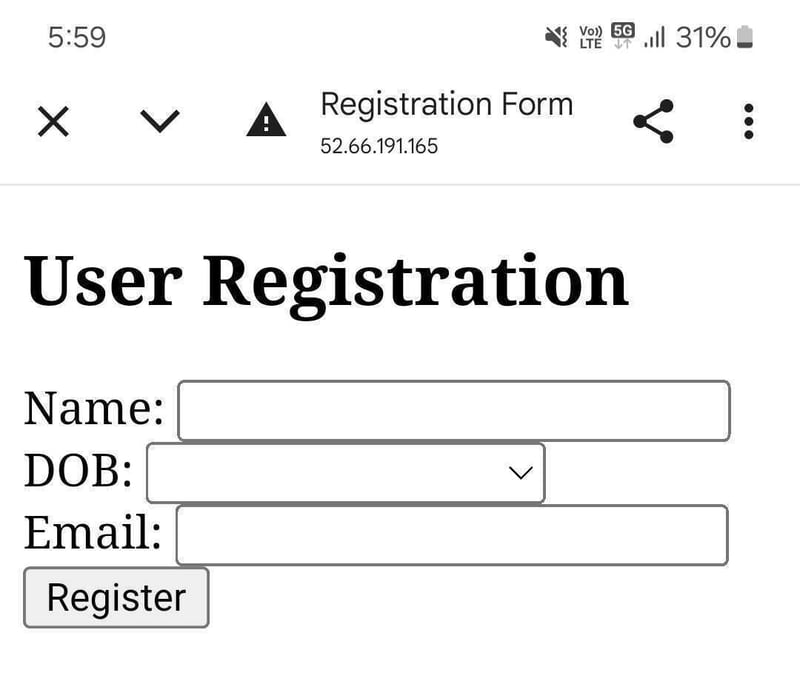
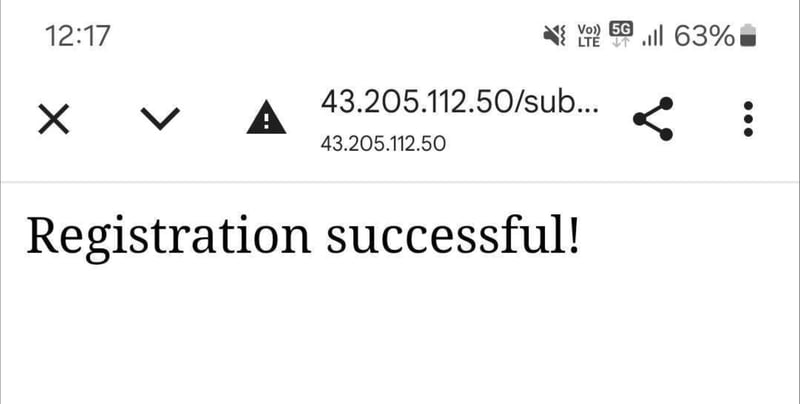
In this blog, I will guide you through step-by-step instructions to set up a two-tier architecture on AWS using VPC, Subnets, Internet Gateway, Route Tables, RDS, EC2, Apache, MySQL, PHP, and HTML. This project will allow you to host a registration web application where users can submit their details, which will be stored in an RDS MySQL database.
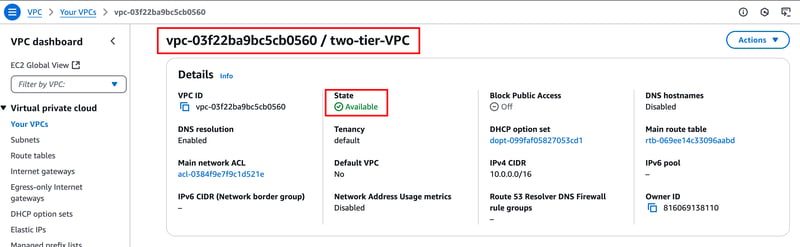
Step 1: Create a VPC
1.1 Login to AWS Management Console
Navigate to the VPC service
Click Create VPC
Enter the following details:
VPC Name: my-vpc
IPv4 CIDR Block: 10.0.0.0/16
Tenancy: Default
Click Create VPC
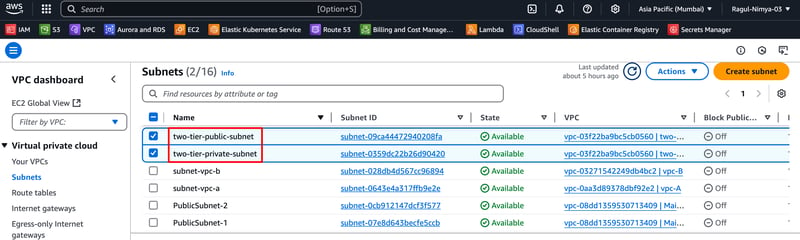
Step 2: Create Subnets
2.1 Create a Public Subnet
Go to VPC > Subnets
Click Create Subnet
Choose my-vpc
Set Subnet Name: public-subnet
IPv4 CIDR Block: 10.0.1.0/24
Click Create
2.2 Create a Private Subnet
Repeat the steps above but set:
Subnet Name: private-subnet
IPv4 CIDR Block: 10.0.2.0/24
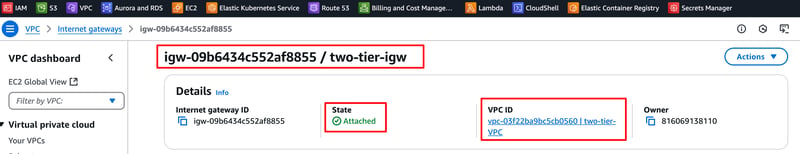
Step 3: Create an Internet Gateway (IGW) and Attach to VPC
3.1 Create IGW
Go to VPC > Internet Gateways
Click Create Internet Gateway
Set Name: your-igw
Click Create IGW
3.2 Attach IGW to VPC
Select your-igw
Click Actions > Attach to VPC
Choose my-vpc and click Attach
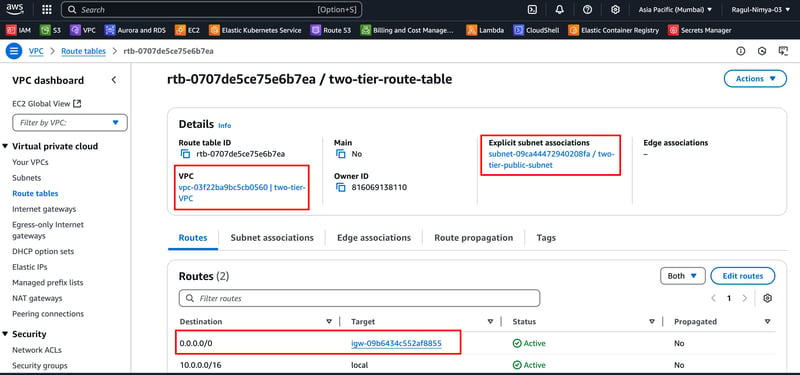
Step 4: Configure Route Tables
4.1 Create a Public Route Table
Go to VPC > Route Tables
Click Create Route Table
Set Name: public-route-table
Choose my-vpc and click Create
Edit Routes → Add a new route:
Destination: 0.0.0.0/0
Target: my-igw
Edit Subnet Associations → Attach public-subnet
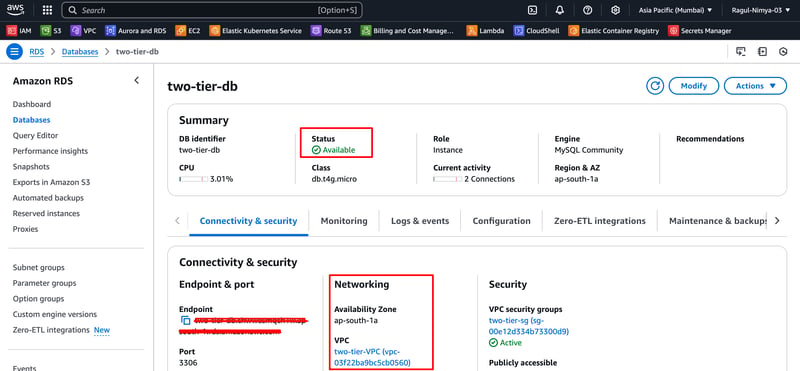
Step 5: Create an RDS Database (MySQL)
Go to RDS > Create Database
Choose Standard Create
Select MySQL
Set DB instance identifier: my-rds
Master Username: admin
Master Password: yourpassword
Subnet Group: Select private-subnet
VPC Security Group: Allow 3306 (MySQL) from my-vpc
Click Create Database
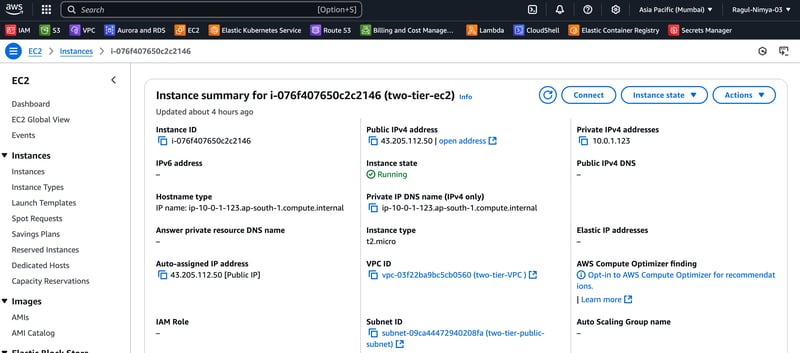
Step 6: Launch an EC2 Instance
Go to EC2 > Launch Instance
Choose Ubuntu 22.04
Set Instance Name: my-ec2
Select my-vpc and attach public-subnet
Security Group: Allow
SSH (22) from your IP
HTTP (80) from anywhere
MySQL (3306) from my-vpc
Click Launch Instance
Step 7: Install Apache, PHP, and MySQL Client
7.1 Connect to EC2
The following IAM policies use condition keys to create tag-based restriction.
Before you use tags to control access to your AWS resources, you must understand how AWS grants access. AWS is composed of collections of resources. An Amazon EC2 instance is a resource. An Amazon S3 bucket is a resource. You can use the AWS API, the AWS CLI, or the AWS Management Console to perform an operation, such as creating a bucket in Amazon S3. When you do, you send a request for that operation. Your request specifies an action, a resource, a principal entity (user or role), a principal account, and any necessary request information.
You can then create an IAM policy that allows or denies access to a resource based on that resource's tag. In that policy, you can use tag condition keys to control access to any of the following:
Resource – Control access to AWS service resources based on the tags on those resources. To do this, use the_ aws:ResourceTag/key-name_ condition key to determine whether to allow access to the resource based on the tags that are attached to the resource.
ResourceTag condition key
Use the _aws:ResourceTag/tag-key _condition key to compare the tag key-value pair that's specified in the IAM policy with the key-value pair that's attached to the AWS resource. For more information, see Controlling access to AWS resources.
You can use this condition key with the global aws:ResourceTag version and AWS services, such as ec2:ResourceTag. For more information, see Actions, resources, and condition keys for AWS services.
The following IAM policy allows users to start, stop, and terminate instances that are in the test application tag
Create the policy and attach the policy to user or role.
Created 2 instance one is with application tag and other is non tagged.
You can see the tagged instance are able to perform Start and Stop action using the IAM resources tag condition.
non-tagged instance we are not able to perform the same.
String condition operators let you construct Condition elements that restrict access based on comparing a key to a string value.
StringEquals - Exact matching, case sensitive
StringNotEquals - Negated matching
StringEqualsIgnoreCase - Exact matching, ignoring case
StringNotEqualsIgnoreCase - Negated matching, ignoring case
StringLike - Case-sensitive matching. The values can include multi-character match wildcards (*) and single-character match wildcards (?) anywhere in the string. You must specify wildcards to achieve partial string matches.
Note
If a key contains multiple values, StringLike can be qualified with set operators—ForAllValues:StringLike and ForAnyValue:StringLike.
StringNotLike - Negated case-sensitive matching. The values can include multi-character match wildcards (*) or single-character match wildcards (?) anywhere in the string.
If we need to fetch the S3 bucket storage size we need to trace via individual bucket under metrics we get the storage size.
on one go use the below script to get the bucket name with storage size.
s3list=`aws s3 ls | awk  '{print $3}'`
for s3dir in $s3list
do
    echo $s3dir
    aws s3 ls "s3://$s3dir"  --recursive --human-readable --summarize | grep "Total Size"
done
Few days back i came across a concept of CDC. Like a notifier of database events. Instead of polling, this enables event to be available in a queue, which can be consumed by many consumers. In this blog, i try to explain the concepts, types in a theoretical manner.
You run a library. Every day, books are borrowed, returned, or new books are added. What if you wanted to keep a live record of all these activities so you always know the exact state of your library?
This is essentially what Change Data Capture (CDC) does for your databases. It’s a way to track changes (like inserts, updates, or deletions) in your database tables and send them to another system, like a live dashboard or a backup system. (Might be a bad example. Don’t lose hope. Continue …)
CDC is widely used in modern technology to power,
Real-Time Analytics: Live dashboards that show sales, user activity, or system performance.
Data Synchronization: Keeping multiple databases or microservices in sync.
Event-Driven Architectures: Triggering notifications, workflows, or downstream processes based on database changes.
Data Pipelines: Streaming changes to data lakes or warehouses for further processing.
Backup and Recovery: Incremental backups by capturing changes instead of full data dumps.
It’s a critical part of tools like Debezium, Kafka, and cloud services such as AWS Database Migration Service (DMS) and Azure Data Factory. CDC enables companies to move towards real-time data-driven decision-making.
What is CDC?
CDC stands for Change Data Capture. It’s a technique that listens to a database and captures every change that happens in it. These changes can then be sent to other systems to,
Keep data in sync across multiple databases.
Power real-time analytics dashboards.
Trigger notifications for certain database events.
Process data streams in real time.
In short, CDC ensures your data is always up-to-date wherever it’s needed.
Why is CDC Useful?
Imagine you have an online store. Whenever someone,
Places an order,
Updates their shipping address, or
Cancels an order,
you need these changes to be reflected immediately across,
The shipping system.
The inventory system.
The email notification service.
Instead of having all these systems query the database (this is one of main reasons) constantly (which is slow and inefficient), CDC automatically streams these changes to the relevant systems.
This means,
Real-Time Updates: Systems receive changes instantly.
Improved Performance: Your database isn’t overloaded with repeated queries.
Consistency: All systems stay in sync without manual intervention.
How Does CDC Work?
Note: I haven’t yet tried all these. But conceptually having a feeling.
CDC relies on tracking changes in your database. There are a few ways to do this,
1. Query-Based CDC
This method repeatedly checks the database for changes. For example:
Every 5 minutes, it queries the database: “What changed since my last check?”
Any new or modified data is identified and processed.
Drawbacks: This can miss changes if the timing isn’t right, and it’s not truly real-time (Long Polling).
2. Log-Based CDC
Most modern databases (like PostgreSQL or MySQL) keep logs of every operation. Log-based CDC listens to these logs and captures changes as they happen.
Advantages
It’s real-time.
It’s lightweight since it doesn’t query the database directly.
3. Trigger-Based CDC
In this method, the database uses triggers to log changes into a separate table. Whenever a change occurs, a trigger writes a record of it.
Advantages: Simple to set up.
Drawbacks: Can slow down the database if not carefully managed.
Tools That Make CDC Easy
Several tools simplify CDC implementation. Some popular ones are,
Debezium: Open-source and widely used for log-based CDC with databases like PostgreSQL, MySQL, and MongoDB.
Striim: A commercial tool for real-time data integration.
AWS Database Migration Service (DMS): A cloud-based CDC service.
StreamSets: Another tool for real-time data movement.
These tools integrate with databases, capture changes, and deliver them to systems like RabbitMQ, Kafka, or cloud storage.
To help visualize CDC, think of,
Social Media Feeds: When someone likes or comments on a post, you see the update instantly. This is CDC in action.
Bank Notifications: Whenever you make a transaction, your bank app updates instantly. Another example of CDC.
In upcoming blogs, will include Debezium implementation with CDC.
Serverless computing allows developers to run applications without having to manage the underlying infrastructure. You write code, deploy it, and the cloud provider takes care of the rest from provisioning servers to scaling applications.
Popular serverless platforms include AWS Lambda, Azure Functions, and Google Cloud Functions.
The Taxi Analogy
Imagine traveling to a destination. There are multiple ways to get there,
Owning a Car (Traditional Servers): You own and maintain your car. This means handling maintenance, fuel, insurance, parking, and everything else that comes with it. It’s reliable and gives you control, but it’s also time-consuming and expensive to manage.
Hiring a Taxi (Serverless): With a taxi, you simply book a ride when you need it. You don’t worry about maintaining the car, fueling it, or where it’s parked afterward. You pay only for the distance traveled, and the service scales to your needs whether you’re alone or with friends.
Why Serverless is Like Taking a Taxi ?
No Infrastructure Management – With serverless, you don’t have to manage or worry about servers, just like you don’t need to maintain a taxi.
Pay-As-You-Go – In a taxi, you pay only for the distance traveled. Similarly, in serverless, you’re billed only for the compute time your application consumes.
On-Demand Availability – Need a ride at midnight? A taxi is just a booking away. Serverless functions work the same way available whenever you need them, scaling up or down as required.
Scalability – Whether you’re a solo traveler or part of a group, taxis can adapt by providing a small car or a larger vehicle. Serverless computing scales resources automatically based on traffic, ensuring optimal performance.
Focus on the Destination – When you take a taxi, you focus on reaching your destination without worrying about the vehicle. Serverless lets you concentrate on writing and deploying code rather than worrying about servers.
Key Benefits of Serverless (and Taxi Rides)
Cost-Effectiveness – Avoid upfront costs. No need to buy servers (or cars) you might not fully utilize.
Flexibility – Serverless platforms support multiple programming languages and integrations. Taxis, too, come in various forms: regular cars, SUVs, and even luxury rides for special occasions.
Reduced Overhead – Free yourself from maintenance tasks, whether it’s patching servers or checking tire pressure.
When Not to Choose Serverless (or a Taxi)
Predictable, High-Volume Usage – Owning a car might be cheaper if you’re constantly on the road. Similarly, for predictable and sustained workloads, traditional servers or containers might be more cost-effective than serverless.
Special Requirements – Need a specific type of vehicle, like a truck for moving furniture? Owning one might make sense. Similarly, applications with unique infrastructure requirements may not be a perfect fit for serverless.
Latency Sensitivity – Taxis take time to arrive after booking. Likewise, serverless functions may experience cold starts, adding slight delays. For ultra-low-latency applications, other architectures may be preferable.
Hybrid origin failover is a strategy that combines two distinct approaches to handle origin failures effectively, balancing speed and resilience.
The Need for Origin Failover
When an application’s primary origin server becomes unavailable, the ability to reroute traffic to a secondary origin ensures continuity. The failover process determines how quickly and effectively this switch happens. Broadly, there are two approaches to implement origin failover:
Stateful Failover with DNS-based Routing
Stateless Failover with Application Logic
Each has its strengths and limitations, which the hybrid approach aims to mitigate.
Stateful Failover
Stateful failover is a system that allows a standby server to take over for a failed server and continue active sessions. It’s used to create a resilient network infrastructure and avoid service interruptions.
This method relies on a DNS service with health checks to detect when the primary origin is unavailable. Here’s how it works,
Health Checks: The DNS service continuously monitors the health of the primary origin using health checks (e.g., HTTP, HTTPS).
DNS Failover: When the primary origin is marked unhealthy, the DNS service resolves the origin’s domain name to the secondary origin’s IP address.
TTL Impact: The failover process honors the DNS Time-to-Live (TTL) settings. A low TTL ensures faster propagation, but even in the most optimal configurations, this process introduces a delay—often around 60 to 70 seconds.
Stateful Behavior: Once failover occurs, all traffic is routed to the secondary origin until the primary origin is marked healthy again.
Implementation from AWS (as-is from aws blog)
The first approach is using Amazon Route 53 Failover routing policy with health checks on the origin domain name that’s configured as the origin in CloudFront. When the primary origin becomes unhealthy, Route 53 detects it, and then starts resolving the origin domain name with the IP address of the secondary origin. CloudFront honors the origin DNS TTL, which means that traffic will start flowing to the secondary origin within the DNS TTLs. The most optimal configuration (Fast Check activated, a failover threshold of 1, and 60 second DNS TTL) means that the failover will take 70 seconds at minimum to occur. When it does, all of the traffic is switched to the secondary origin, since it’s a stateful failover. Note that this design can be further extended with Route 53 Application Recovery Control for more sophisticated application failover across multiple AWS Regions, Availability Zones, and on-premises.
The second approach is using origin failover, a native feature of CloudFront. This capability of CloudFront tries for the primary origin of every request, and if a configured 4xx or 5xx error is received, then CloudFront attempts a retry with the secondary origin. This approach is simple to configure and provides immediate failover. However, it’s stateless, which means every request must fail independently, thus introducing latency to failed requests. For transient origin issues, this additional latency is an acceptable tradeoff with the speed of failover, but it’s not ideal when the origin is completely out of service. Finally, this approach only works for the GET/HEAD/OPTIONS HTTP methods, because other HTTP methods are not allowed on a CloudFront cache behavior with Origin Failover enabled.
Relatively slower failover due to DNS propagation time.
Requires a reliable health-check mechanism.
Approach 2: Stateless Failover with Application Logic
This method handles failover at the application level. If a request to the primary origin fails (e.g., due to a 4xx or 5xx HTTP response), the application or CDN immediately retries the request with the secondary origin.
How It Works
Primary Request: The application sends a request to the primary origin.
Failure Handling: If the response indicates a failure (configurable for specific error codes), the request is retried with the secondary origin.
Stateless Behavior: Each request operates independently, so failover happens on a per-request basis without waiting for a stateful switchover.
Implementation from AWS (as-is from aws blog)
The hybrid origin failover pattern combines both approaches to get the best of both worlds. First, you configure both of your origins with a Failover Policy in Route 53 behind a single origin domain name. Then, you configure an origin failover group with the single origin domain name as primary origin, and the secondary origin domain name as secondary origin. This means that when the primary origin becomes unavailable, requests are immediately retried with the secondary origin until the stateful failover of Route 53 kicks in within tens of seconds, after which requests go directly to the secondary origin without any latency penalty. Note that this pattern only works with the GET/HEAD/OPTIONS HTTP methods.
Advantages
Near-instantaneous failover for failed requests.
Simple to configure and doesn’t depend on DNS TTL.
Disadvantages
Adds latency for failed requests due to retries.
Limited to specific HTTP methods like GET, HEAD, and OPTIONS.
Not suitable for scenarios where the primary origin is entirely down, as every request must fail first.
The Hybrid Origin Failover Pattern
The hybrid origin failover pattern combines the strengths of both approaches, mitigating their individual limitations. Here’s how it works:
DNS-based Stateful Failover: A DNS service with health checks monitors the primary origin and switches to the secondary origin if the primary becomes unhealthy. This ensures a complete and stateful failover within tens of seconds.
Application-level Stateless Failover: Simultaneously, the application or CDN is configured to retry failed requests with a secondary origin. This provides an immediate failover mechanism for transient or initial failures.
Implementation Steps
DNS Configuration
Set up health checks on the primary origin.
Define a failover policy in the DNS service, which resolves the origin domain name to the secondary origin when the primary is unhealthy.
Application Configuration
Configure the application or CDN to use an origin failover group.
Specify the primary origin domain as the primary origin and the secondary origin domain as the backup.
Behavior
Initially, if the primary origin encounters issues, requests are retried immediately with the secondary origin.
Meanwhile, the DNS failover switches all traffic to the secondary origin within tens of seconds, eliminating retry latencies for subsequent requests.
Benefits of Hybrid Origin Failover
Faster Failover: Immediate retries for failed requests minimize initial impact, while DNS failover ensures long-term stability.
Reduced Latency: After DNS failover, subsequent requests don’t experience retry delays.
High Resilience: Combines stateful and stateless failover for robust redundancy.
Simplicity and Scalability: Leverages existing DNS and application/CDN features without complex configurations.
Limitations and Considerations
HTTP Method Constraints: Stateless failover works only for GET, HEAD, and OPTIONS methods, limiting its use for POST or PUT requests.
TTL Impact: Low TTLs reduce propagation delays but increase DNS query rates, which could lead to higher costs.
Configuration Complexity: Combining DNS and application-level failover requires careful setup and testing to avoid misconfigurations.
Secondary Origin Capacity: Ensure the secondary origin can handle full traffic loads during failover.
Today, i learnt about Queue Based Loading pattern, which helps to manage intermittent peak load to a service via queues. Basically decoupling Tasks from Services. In this blog i jot down notes on this pattern for my future self.
In today’s digital landscape, applications are expected to handle large-scale operations efficiently. Whether it’s processing massive data streams, ensuring real-time responsiveness, or integrating with multiple third-party services, scalability and reliability are paramount. One pattern that elegantly addresses these challenges is the Queue-Based Loading Pattern.
What Is the Queue-Based Loading Pattern?
The Queue-Based Loading Pattern leverages message queues to decouple and coordinate tasks between producers (such as applications or services generating data) and consumers (services or workers processing that data). By using queues as intermediaries, this pattern allows systems to manage workloads efficiently, ensuring seamless and scalable operation.
Key Components of the Pattern
Producers: Producers are responsible for generating tasks or data. They send these tasks to a message queue instead of directly interacting with consumers. Examples include:
Web applications logging user activity.
IoT devices sending sensor data.
Message Queue: The queue acts as a buffer, storing tasks until consumers are ready to process them. Popular tools for implementing queues include RabbitMQ, Apache Kafka, AWS SQS, and Redis.
Consumers: Consumers retrieve messages from the queue and process them asynchronously. They are typically designed to handle tasks independently and at their own pace.
Processing Logic: This is the core functionality that processes the tasks retrieved by consumers. For example, resizing images, sending notifications, or updating a database.
How It Works
Task Generation: Producers push tasks to the queue as they are generated.
Message Storage: The queue stores tasks in a structured manner (FIFO, priority-based, etc.) and ensures reliable delivery.
Task Consumption: Consumers pull tasks from the queue, process them, and optionally acknowledge completion.
Scalability: New consumers can be added dynamically to handle increased workloads, ensuring the system remains responsive.
Benefits of the Queue-Based Loading Pattern
Decoupling: Producers and consumers operate independently, reducing tight coupling and improving system maintainability.
Scalability: By adding more consumers, systems can easily scale to handle higher workloads.
Fault Tolerance: If a consumer fails, messages remain in the queue, ensuring no data is lost.
Load Balancing: Tasks are distributed evenly among consumers, preventing any single consumer from becoming a bottleneck.
Asynchronous Processing: Consumers can process tasks in the background, freeing producers to continue generating data without delay.
Issues and Considerations
Rate Limiting: Implement logic to control the rate at which services handle messages to prevent overwhelming the target resource. Test the system under load and adjust the number of queues or service instances to manage demand effectively.
One-Way Communication: Message queues are inherently one-way. If tasks require responses, you may need to implement a separate mechanism for replies.
Autoscaling Challenges: Be cautious when autoscaling consumers, as it can lead to increased contention for shared resources, potentially reducing the effectiveness of load leveling.
Traffic Variability: Consider the variability of incoming traffic to avoid situations where tasks pile up faster than they are processed, creating a perpetual backlog.
Queue Persistence: Ensure your queue is durable and capable of persisting messages. Crashes or system limits could lead to dropped messages, risking data loss.
Use Cases
Email and Notification Systems: Sending bulk emails or push notifications without overloading the main application.
Data Pipelines: Ingesting, transforming, and analyzing large datasets in real-time or batch processing.
Video Processing: Queues facilitate tasks like video encoding and thumbnail generation.
Microservices Communication: Ensures reliable and scalable communication between microservices.
Best Practices
Message Durability: Configure your queue to persist messages to disk, ensuring they are not lost during system failures.
Monitoring and Metrics: Use monitoring tools to track queue lengths, processing rates, and consumer health.
Idempotency: Design consumers to handle duplicate messages gracefully.
Error Handling and Dead Letter Queues (DLQs): Route failed messages to DLQs for later analysis and reprocessing.
Today, i learnt about claim check pattern, which tells how to handle a big message into the queue. Every message broker has a defined message size limit. If our message size exceeds the size, it wont work.
The Claim Check Pattern emerges as a pivotal architectural design to address challenges in managing large payloads in a decoupled and efficient manner. In this blog, i jot down notes on my learning for my future self.
What is the Claim Check Pattern?
The Claim Check Pattern is a messaging pattern used in distributed systems to manage large messages efficiently. Instead of transmitting bulky data directly between services, this pattern extracts and stores the payload in a dedicated storage system (e.g., object storage or a database).
A lightweight reference or “claim check” is then sent through the message queue, which the receiving service can use to retrieve the full data from the storage.
This pattern is inspired by the physical process of checking in luggage at an airport: you hand over your luggage, receive a claim check (a token), and later use it to retrieve your belongings.
How Does the Claim Check Pattern Work?
The process typically involves the following steps
Data Submission The sender service splits a message into two parts:
Metadata: A small piece of information that provides context about the data.
Payload: The main body of data that is too large or sensitive to send through the message queue.
Storing the Payload
The sender uploads the payload to a storage service (e.g., AWS S3, Azure Blob Storage, or Google Cloud Storage).
The storage service returns a unique identifier (e.g., a URL or object key).
Sending the Claim Check
The sender service places the metadata and the unique identifier (claim check) onto the message queue.
Receiving the Claim Check
The receiver service consumes the message from the queue, extracts the claim check, and retrieves the payload from the storage system.
Processing
The receiver processes the payload alongside the metadata as required.
Use Cases
1. Media Processing Pipelines In video transcoding systems, raw video files can be uploaded to storage while metadata (e.g., video format and length) is passed through the message queue.
2. IoT Systems – IoT devices generate large datasets. Using the Claim Check Pattern ensures efficient transmission and processing of these data chunks.
3. Data Processing Workflows – In big data systems, datasets can be stored in object storage while processing metadata flows through orchestration tools like Apache Airflow.
4. Event-Driven Architectures – For systems using event-driven models, large event payloads can be offloaded to storage to avoid overloading the messaging layer.
Today, i got refreshed on Blue Green Deployment from a podcast https://open.spotify.com/episode/03p86zgOuSEbNezK71CELH. Deployment designing is a plate i haven’t touched yet. In this blog i jot down the notes on blue green deployment for my future self.
What is Blue-Green Deployment?
Blue-Green Deployment is a release management strategy that involves maintaining two identical environments, referred to as “Blue” and “Green.” At any point in time, only one environment is live (receiving traffic), while the other remains idle or in standby. Updates are deployed to the idle environment, thoroughly tested, and then switched to live with minimal downtime.
How It Works
This approach involves setting up two environments: the Blue environment, which serves live traffic, and the Green environment, a replica used for staging updates.
Updates are first deployed to the Green environment, where comprehensive testing is performed to ensure functionality, performance, and integration meet expectations.
Once testing is successful, the routing mechanism, such as a DNS or API Gateway or load balancer, is updated to redirect traffic from the Blue environment to the Green environment.
The Green environment then becomes live, while the Blue environment transitions to an idle state.
If issues arise, traffic can be reverted to the Blue environment for a quick recovery with minimal impact.
Benefits of Blue-Green Deployment
Blue-Green Deployment provides zero downtime during the deployment process, ensuring uninterrupted user experiences.
Rollbacks are simplified because the previous version remains intact in the Blue environment, enabling quick reversion if necessary. Consideration of forward and backwar capability is important. eg, Database.
It also allows seamless testing in the Green environment before updates go live, reducing risks by isolating production from deployment issues.
Challenges and Considerations
Maintaining two identical environments can be resource intensive.
Ensuring synchronization between environments is critical to prevent discrepancies in configuration and data.
Handling live database changes during the environment switch is complex, requiring careful planning for database migrations.
Several tools and platforms support Blue-Green Deployment. Kubernetes simplifies managing multiple environments through namespaces and services.
AWS Elastic Beanstalk offers built-in support for Blue-Green Deployment, while HashiCorp Terraform automates the setup of Blue-Green infrastructure.
To implement this strategy, organizations should design infrastructure capable of supporting two identical environments, automate deployments using CI/CD pipelines, monitor and test thoroughly, and define rollback procedures to revert to previous versions when necessary.
As part of cloud design patterns, today i learned about Gateway Aggregation Pattern. It seems like a motivation for GraphQL. In this blog, i write down the notes on Gateway Aggregation Pattern for my future self.
In the world of microservices, applications are often broken down into smaller, independent services, each responsible for a specific functionality.
While this architecture promotes scalability and maintainability, it can complicate communication between services. The Gateway Aggregation Pattern emerges as a solution, enabling streamlined interactions between clients and services.
What is the Gateway Aggregation Pattern?
The Gateway Aggregation Pattern involves introducing a gateway layer to handle requests from clients. Instead of the client making multiple calls to different services, the gateway aggregates the data by making calls to the relevant services and then returning a unified response to the client.
This pattern is particularly useful for:
Reducing the number of round-trips between clients and services.
Simplifying client logic.
Improving performance by centralizing the communication and aggregation logic.
How It Works
Client Request: The client sends a single request to the gateway.
Gateway Processing: The gateway makes multiple requests to the required services, aggregates their responses, and applies any necessary transformation.
Unified Response: The gateway sends a unified response back to the client.
This approach abstracts the complexity of service interactions from the client, improving the overall user experience.
Example Use Case
Imagine an e-commerce application where a client needs to display a product’s details, reviews, and availability. Without a gateway, the client must call three different microservices
Product Service: Provides details like name, description, and price.
Review Service: Returns customer reviews and ratings.
Using the Gateway Aggregation Pattern, the client makes a single request to the gateway. The gateway calls the three services, aggregates their responses, and returns a combined result, such as
By consolidating service calls and centralizing the aggregation logic, this pattern enhances performance and reduces complexity. Open-source tools like Express.js, Apache APISIX, Kong Gateway, and GraphQL make it easy to implement the pattern in diverse environments.
Efficiently managing Amazon Elastic Kubernetes Service (EKS) clusters is critical for maintaining cost-effectiveness and performance. Automating the process of starting and stopping EKS clusters using AWS Lambda ensures optimal utilization and reduces manual intervention. Below is a structured approach to achieve this.
1. Define the Requirements
Identify the clusters that need automated start/stop operations.
Determine the dependencies among clusters, if any, to ensure smooth transitions.
Establish the scaling logic, such as leveraging tags to specify operational states (e.g., auto-start, auto-stop).
2. Prepare the Environment
AWS CLI Configuration: Ensure the AWS CLI is set up with appropriate credentials and access.
IAM Role for Lambda:
Create a role with permissions to manage EKS clusters (eks:DescribeCluster, eks:UpdateNodegroupConfig, etc.).
Include logging permissions for CloudWatch Logs to monitor the Lambda function execution.
3. Tag EKS Clusters
Use resource tagging to identify clusters for automation.
Example tags:
auto-start=true: Indicates clusters that should be started by the Lambda function.
dependency=<cluster-name>: Specifies any inter-cluster dependencies.
4. Design the Lambda Function
Trigger Setup:
Use CloudWatch Events or schedule triggers (e.g., daily or weekly) to invoke the function.
Environment Variables: Configure the function with environment variables for managing cluster names and dependency details.
Scaling Configuration: Ensure the function dynamically retrieves scaling logic via tags to handle operational states.
5. Define the Workflow
Fetch Cluster Information: Use AWS APIs to retrieve cluster details, including their tags and states.
Check Dependencies:
Identify dependent clusters and validate their status before initiating operations on others.
Start/Stop Clusters:
Update node group configurations or use cluster-level start/stop APIs where supported.
Implement Logging and Alerts: Capture the execution details and errors in CloudWatch Logs.
(If you want my code , just comment "ease-py-code" on my blog , will share you 🫶 )
6. Test and Validate
Dry Runs: Perform simulations to ensure the function executes as expected without making actual changes.
Dependency Scenarios: Test different scenarios involving dependencies to validate the logic.
Error Handling: Verify retries and exception handling for potential API failures.
7. Deploy and Monitor
Deploy the Function: Once validated, deploy the Lambda function in the desired region.
Set Up Monitoring:
Use CloudWatch Metrics to monitor function executions and errors.
Configure alarms for failure scenarios to take corrective actions.
By automating the start and stop operations for EKS clusters, organizations can significantly enhance resource management and optimize costs. This approach provides scalability and ensures that inter-cluster dependencies are handled efficiently.
Managing AWS resources efficiently often requires automation. One common task is exporting a list of IAM users into a CSV file for auditing or reporting purposes. AWS Lambda is an excellent tool to achieve this, combined with the power of S3 for storage. Here's a step-by-step guide:
Step 1: Understand the Requirements
Before starting, ensure you have the following:
IAM permissions to list users (iam:ListUsers) and access S3 (s3:PutObject).
An existing S3 bucket to store the generated CSV file.
A basic understanding of AWS Lambda and its environment.
Step 2: Create an S3 Bucket
Log in to the AWS Management Console.
Navigate to S3 and create a new bucket or use an existing one.
Note the bucket name for use in the Lambda function.
Step 3: Set Up a Lambda Function
Go to the Lambda service in the AWS Console.
Click on Create Function and choose the option to create a function from scratch.
Configure the runtime environment (e.g., Python or Node.js).
Assign an appropriate IAM role to the Lambda function with permissions for IAM and S3 operations. (If you want my code , just comment "ease-py-code" on my blog , will share you 🫶 )
Step 4: Implement Logic for IAM and S3
The Lambda function will:
Retrieve a list of IAM users using the AWS SDK.
Format the list into a CSV structure.
Upload the file to the specified S3 bucket.
Step 5: Test the Function
Use the AWS Lambda testing tools to trigger the function.
Verify that the CSV file is successfully uploaded to the S3 bucket.
Step 7: Monitor and Review
Check the S3 bucket for the uploaded CSV files.
Review the Lambda logs in CloudWatch to ensure the function runs successfully.
By following these steps, you can automate the task of exporting IAM user information into a CSV file and store it securely in S3, making it easier to track and manage your AWS users.
Monitoring AWS costs is essential for keeping budgets in check. In this guide, we’ll walk through creating an AWS Lambda function to retrieve cost details and send them to email (via SES) and Slack.
Prerequisites
1.AWS Account with IAM permissions for Lambda, SES, and Cost Explorer.
2.Slack Webhook URL to send messages.
3.Configured SES Email for notifications.
4.S3 Bucket for storing cost reports as CSV files.
Step 1: Enable Cost Explorer
Go to AWS Billing Dashboard > Cost Explorer.
Enable Cost Explorer to access detailed cost data.
Step 2: Create an S3 Bucket
Create an S3 bucket (e.g., aws-cost-reports) to store cost reports.
Ensure the bucket has appropriate read/write permissions for Lambda.
Step 3: Write the Lambda Code
1.Create a Lambda Function
Go to AWS Lambda > Create Function.
Select Python Runtime (e.g., Python 3.9).
Add Dependencies
Use a Lambda layer or package libraries like boto3 and slack_sdk.
3.Write your python code and execute them. (If you want my code , just comment "ease-py-code" on my blog , will share you 🫶 )
Step 4: Add S3 Permissions
Update the Lambda execution role to allow s3:PutObject, ses:SendEmail, and ce:GetCostAndUsage.
Step 5: Test the Lambda
1.Trigger Lambda manually using a test event.
Verify the cost report is:
Uploaded to the S3 bucket.
Emailed via SES.
Notified in Slack.
Conclusion
With this setup, AWS cost reports are automatically delivered to your inbox and Slack, keeping you updated on spending trends. Fine-tune this solution by customizing the report frequency or grouping costs by other dimensions.
Hi folks , welcome to my blog. Here we are going to see about some interesting deep topics in AWS.
What is AWS?
AWS is a subsidiary of Amazon that offers on-demand cloud computing services. These services eliminate the need for physical infrastructure, allowing businesses to rent computing power, storage, and other resources as needed. AWS operates on a pay-as-you-go model, which means you only pay for what you use.
Deep Dive: Serverless Architecture
One of AWS’s most revolutionary offerings is serverless computing. Traditional servers are replaced with fully managed services, allowing developers to focus solely on writing code.
Key Components of Serverless Architecture:
AWS Lambda: Automatically scales based on the number of requests. Ideal for microservices and event-driven workflows.
API Gateway: Connects client applications with backend services using APIs.
DynamoDB: High-performance NoSQL database for low-latency reads and writes.
EventBridge: Orchestrates serverless workflows using event-driven triggers.
Example Use Case: Build a RESTful API without managing servers. Combine Lambda for compute, DynamoDB for storage, and API Gateway for routing.
Advanced Concepts in AWS
1. Elasticity and Auto-Scaling
AWS Auto Scaling monitors your application and adjusts capacity automatically to maintain performance. For example, if traffic spikes, AWS can add more EC2 instances or scale down when traffic reduces.
2. Hybrid Cloud and Outposts
Hybrid cloud models integrate on-premises infrastructure with AWS. AWS Outposts allow you to run AWS services on your own hardware, enabling low-latency solutions for specific industries.
3. High Availability and Disaster Recovery
AWS provides tools like:
Route 53 for DNS failover.
Cross-Region Replication for S3.
AWS Backup for centralized backup management across multiple services.
4. Monitoring and Logging
CloudWatch: Collect and monitor logs, metrics, and events.
CloudTrail: Records all API calls for auditing purposes.
AWS Config: Tracks changes to your resources for compliance.
Conclusion
AWS empowers organizations to innovate faster by providing scalable, secure, and cost-effective solutions. Whether you’re deploying a simple static website or a complex AI-powered application, AWS has the tools to support your goals. By leveraging its services and following best practices, you can build resilient and future-ready applications.
Hi folks , welcome to my blog. Here we are going to see about "Introduction to AWS".
Amazon Web Services (AWS) is the world’s leading cloud computing platform, offering a wide range of services to help businesses scale and innovate. Whether you're building an application, hosting a website, or storing data, AWS provides reliable and cost-effective solutions for individuals and organizations of all sizes.
What is AWS?
AWS is a comprehensive cloud computing platform provided by Amazon. It offers on-demand resources such as compute power, storage, networking, and databases on a pay-as-you-go basis. This eliminates the need for businesses to invest in and maintain physical servers.
Core Benefits of AWS
Scalability: AWS allows you to scale your resources up or down based on your needs.
Cost-Effective: With its pay-as-you-go pricing, you only pay for what you use.
Global Availability: AWS has data centers worldwide, ensuring low latency and high availability.
Security: AWS follows a shared responsibility model, offering top-notch security features like encryption and access control.
Flexibility: Supports multiple programming languages, operating systems, and architectures.
Key AWS Services
Here are some of the most widely used AWS services:
Compute:
Amazon EC2: Virtual servers to run your applications.
AWS Lambda: Serverless computing to run code without managing servers.
Storage:
Amazon S3: Object storage for data backup and distribution.
Amazon EBS: Block storage for EC2 instances.
Database:
Amazon RDS: Managed relational databases like MySQL, PostgreSQL, and Oracle.
Amazon DynamoDB: NoSQL database for high-performance applications.
Networking:
Amazon VPC: Create isolated networks in the cloud.
Amazon Route 53: Domain name system (DNS) and traffic management.
AI/ML:
Amazon SageMaker: Build, train, and deploy machine learning models.
DevOps Tools:
AWS CodePipeline: Automates the release process.
Amazon EKS: Managed Kubernetes service.
Conclusion
AWS has revolutionized the way businesses leverage technology by providing scalable, secure, and flexible cloud solutions. Whether you're a developer, an enterprise, or an enthusiast, understanding AWS basics is the first step toward mastering the cloud. Start your AWS journey today and unlock endless possibilities!
Something like this would take more than an hour! Lets do it in less than 5 minutes.
Now ofcourse there are several ways to make this faster – using copy expert, psycogpg driver etc(maybe a sepearate blog post on these), but that’s not the use case I have been tasked with. Since we need to upload the file s3 in the end for audit purposes I will ingest the data from S3 to DB.
Generate table metadata
Before we can assign an s3 operator to ingest the data we need to create the table into which this data will be inserted. We have two ways that I can think of
Each column in the file will be created in the DB with a highest threshold value like varchar(2000)
Each column is created with the data length as max length in each row
I will be going with option 2 here.
This entire process took around 210 seconds instead of more than an hour like the last run.
Let’s go over the code one by one
Read the csv
We can pass the data directly to pandas or stream it into buffered memory something like this
with open("records.csv") as f:
    csv_rdr = csv.reader(f, delimiter=",")
    header = next(csv_rdr)
    with gzip.GzipFile(fileobj=mem_file, mode="wb", compresslevel=6) as gz:
        buff = io.StringIO()
        writer = csv.writer(buff)
        writer.writerows([header])
        for row in csv_rdr:
            writer.writerows([row])
        gz.write(buff.getvalue().encode("utf-8", "replace"))
    mem_file.seek(0)
    s3.put_object(Bucket="mybucket", Key="folder/file.gz", Body=mem_file)
2. Since the file is less than 50 MB i’ll go ahead and load it directly.
Create the table
Get the max lengths of each column and use that to generate the table. We use pandas to_sql() function for this and pass the dtypes.
If your application allows your users to download files directly from s3, you are bound to get this error sometime in the future whenever you scale to other regions – The authorization mechanism you have provided is not supported. Please use AWS4-HMAC-SHA256.
Hosting your own WordPress website is interesting right!! Ok, come on let’s do it!!
We are going to do this practical from Scratch. From the Creation of our Own VPC, Subnets, Internet Gateway, Route tables to Deployment of WordPress.
Here, we are going to use Amazon Web Service’s RDS service for hosting our own WordPress site. Before that, let’s take a look at a basic introduction to RDS service.
Amazon Relational Database Service is a distributed relational database service by Amazon Web Services (AWS). It is a web service running in the cloud designed to simplify the setup, operation, and scaling of a relational database for use in applications. Administration processes like patching the database software, backing up databases and enabling point-in-time recovery are managed automatically.
Features of AWS RDS
Lower administrative burden. Easy to use
Performance. General Purpose (SSD) Storage
Scalability. Push-button compute scaling
Availability and durability. Automated backups
Security. Encryption at rest and in transit
Manageability. Monitoring and metrics
Cost-effectiveness. Pay only for what you use
Ok, let’s jump onto the practical part!!
We will do this practical from scratch. Since it will be big, so we divided this into 5 small parts namely
Creating a MySQL database with RDS
Creating an EC2 instance
Configuring your RDS database
Configuring WordPress on EC2
Deployment of WordPress website
Creating a MySQL database with RDS
Before that, we have to do two pre-works namely the Creation of Virtual Private Cloud(VPC), Subnets and Security groups. These are more important because in order to have a reliable connection between WordPress and MySQL database, they should be located in the same VPC and should have the same Security Group.
Since Instances are launched on Subnets only, Moreover RDS will launch your MySQL database in EC2 instance only that we cannot able to see since it is fully managed by AWS.
VPC Dashboard
We are going to create our own VPC. For that, we have to specify IP range and CIDR. We specified IP and CIDR as 192.168.0.0/16.
What is CIDR?. I explained this in my previous blog in very detail. You can refer here.
Lets come to the point. After specifying the IP range and CIDR, enter your VPC name.
Now, VPC is successfully created with our specified details.
Next step is to launch the subnet in the above VPC.
Subnet Dashboard
For Creating Subnets, you have to specify which VPC the lab should launch. We already have our own VPC named “myvpc123”.
And then we have to specify the range of Subnet IP and CIDR. Please note that the Subnet range should come under VPC range, it should not exceedVPC range.
For achieving the property of High Availability, We have to launch minimum two subnets, so that Amazon RDS will launch its database in two subnets, if one subnet collapsed means, it won’t cause any trouble.
Now, two Subnets with their specified range of IPs and CIDR are launched successfully inside our own VPC and they are available.
Next step is to create a security group in order to secure the WordPress and MySQL databases. Note that both should have the same Security Group or else it won’t connect.
For creating a Security Group, we have to specify which VPC it should be launched and adding a Description is mandatory.
Then we have to specify inbound rules, for making this practical simple, we are allowing all traffic to access our instance.
Now, the Security Group is successfully created with our specified details.
Now let’s jump into part 1 which is about Creating a MySQL database with RDS.
RDS dashboard
Select Create database, then select Standard create and specify the database type.
Then you have to specify the Version. Version plays a major role in MySQL when integrating with WordPress, so select the compactible version or else it will cause serious trouble at the end. Then select the template, here we are using Free-tier since it won’t be chargeable.
Then you have to specify the credentials such as Database Instance name, Master username and Master password.
Most important part is a selection of VPC, you should select the same VPC where you will launch your EC2 instance for your WordPress and we can’t modify the VPC once the database is created. Then select the Public access as No for providing more security to our database. Now, the people outside of your VPC can’t connect to your database.
Then you have to specify the security group for your database. Note that the Security Group for your database and WordPress should be the same or else it will cause serious trouble.
Note that Security Groups is created per VPC. After selecting Security Group, then click Ok to create the RDS database.
Creating an EC2 instance
Before creating an instance, there should be two things you configured namely Internet Gateway and Route tables. It is used for providing outside internet connectivity to an instance launched in the subnet.
Internet Gateway Dashboard
Internet Gateway is created per VPC. First, we have to create one new Internet Gateway with the specified details.
Then you have to attach Internet Gateway to the VPC
Next step is to create Routing tables. Note that Route table is created per Subnet.
We have to specify which VPC in which your subnet is available to attach routing table with it, specify Name and click create to create the route table.
Then click Edit route to edit the route details namely destination and target. Enter destination as 0.0.0.0/0 for accessing any IP anywhere on the Internet and target is your Internet Gateway.
After entering the details, click Save routes.
We created a Route table, then we have to attach that table to your Subnet. For that click Edit route table association and select your subnet where you want to attach the route table with it.
Now, lets jump into the task of creating an EC2 instance.
First, you have to choose the AMI image in which you used for creating an EC2 instance, here I selected Amazon Linux 2 AMI for that.
Then you have to select Instance type, here I selected t2.micro since it comes under free tier.
Then you have to specify the VPC,Subnet for your instance and you have to enable Auto-assign Public IP in order to get your Public IP to your instance.
Then you have to add storage for your instance. It is optional only.
Then you have to specify the tags which will be more useful especially for automation.
Then you have to select the Security Group for your instance. It should be the same as your database have.
And click Review and Launch. Then you have to add Keypair to launch your EC2 instance. If you didn’t have Keypair means, you can create at that time.
Configuring your RDS database
At this point, you have created an RDS database and an EC2 instance. Now, we will configure the RDS database to allow access to specific entities.
You have to run the below command in your EC2 instance in order to establish the connection with your database.
export MYSQL_HOST=<your-endpoint>
You can find your endpoint by clicking database in the RDS dashboard. Then you have to run the following command.
mysql --user=<user> --password=<password> dbname
This output shows the database is successfully connected to an EC2 instance.
In the MySQL command terminal, you have to run the following commands in order to get all privileges to your account.
CREATE USER 'vishnu' IDENTIFIED BY 'vishnupassword';
GRANT ALL PRIVILEGES ON dbname.* TO vishnu;
FLUSH PRIVILEGES;
Exit
Configuring WordPress on EC2
For Configuring WordPress on EC2 instance, the first step is to configure the webserver, here I am using Apache webserver. For that, you have to run the following commands.
sudo yum install -y httpd
sudo service httpd start
Next step would be download the WordPress application from the internet by using wget command. Run the following code to download the WordPress application.
wget https://wordpress.org/latest.tar.gz
tar -xzf latest.tar.gz
Then we have to do some configuration, for this follow the below steps.
cd wordpress
cp wp-config-sample.php wp-config.php
cd wp-config.php
Go inside the wp-config.php file and enter your credentials (including your password too)
Then, Goto thislinkand copy all and paste it to replace the existing lines of code.
Next step is to deploy the WordPress application. For that, you have to run the following commands in order to solve the dependencies and deployWordPress in the webserver.