Linux -top command
top is a monitor the system performance in real time
1.System Information

=>16:43:14 current time
=>up 4:31 system uptime is 4 hours 31 mintues
=>2 users - 2 user logged
=>load average
load-0.10 (last 1 minutes )
load-0.07 (last 5 minutes)
load-0.02 (last 15 minutes)
< 1.00 per core - good
= 1.00 per core - full used
=> > 1.00 per core - overloaded
for example
0.00 means system is idle(free) nothing do
1.00 means system busy, more then 1 overloaded
what is mean load?
no.of process waiting for cpu or input/output writing or reading from disk
=>check cpu core use nproc or lscpu after compare with core value and load average value, it tells your system low ,normal, high load
what is mean core?
each core can do one task at atime
example:
you system have 4 core ,1 work easily and fast done work.
example
*Load average value =or < or > No.of.core (nproc command use and get core value)
2.process information
![]()
=>237 - total no.of process
=>1 - one process actively running( every program in Linux treated as process)
=>236 - sleeping ,waiting particular action like user input and network request ....etc
=>0 stopped - 0 process not manually stopped
=>0 zombie - ( zombie is child process of parent process ,when parent process killed it also affect to child process ,child will takeover(adopt) the init by cleared or terminated form process table)
3.cpu usage line
![]()
us - user cpu time , used by normal process like apps ,scripts(0-50% is normal,<10% free,>70% high).
sy - system cpu time used system/kernel related tasks(good <10%,>20% system issue)
ni - nice ,it used to low priority process (0% unused, >20% id low priority jobs)
id -idle, mean cpu is free (>80% ideal,<20% heay load )
`wa` - wait i/o ,it means how much time cpu is waiting disk or network operation(<5%good ,bad>10%).
hi - hardware interrupts -> cpu time to spend handling hardware (keyboard, mouse...etc)tasks (<2% good ,bad >10%)
si -software interrupts -> cpu time to spend handling software interrupts (<2% good,bad>10%)
st - stolen time -> like stolen time virtual machine or hypervisor
mpstat -P ALL (similar to top)
4.Memory usage

total => total Ram in Mib ->1771 MiB
free => available ram
used => ram used by process
buff/cache => cached memory
avail Mem => available memory
buff/cache => memory use by system cache file and buffer data ,for example if open a file ,Linux keep the cache ,next time it faster to open file.
example:
MiB Mem
MiB = Mebibyte = 1024 × 1024 bytes
1771/1024 =1.73GB
MiB Swap(vritual memory)
-swap is extra memory on HDD or SDD ,used only ram is full, ram is full inactive data moved swap place ,it avoid to system crash and other things .ram is very fast(rabbit), swap is slower(tortoise).
5.process Table
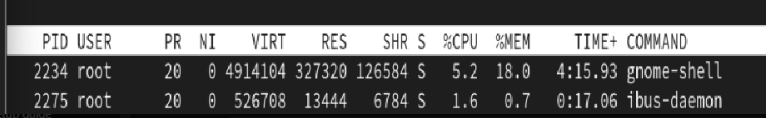
PID
USER => who(which user) run the process
PR =>priority of process like lower to higher
NI => nice value set the new process priority value ,renice command change nice priority value
VIRT => swap + Ram = virtual memory(total memory)
RES => only for physical ram
SHR => shared memory
S => process status, s-sleep, R-Running, z-Zombie, X -dead, T-stopped, I -idle
%CPU => cpu usage of process
%MEM => total ram used
TIME+ =>total cpu run time
COMMAND => command running ,name of the command or program that started the process
key of top commands:-
M => sort the memory usage
P => sort the cpu usage
T => sort Time
k => kill the process ( press k button then system ask pid then signal number you can see different signal was $kill -l( mostly used 1,9,15,2,3 the we will depth info kill command )
r => renice process priority
(k and r only work sudo top)
q => quit
z => switch the color for visibility
shift +e => switch the memory to display kb, gb, mb.
h=> help
1 =>display the cpu usage core level
top -u prasanth362k - display specific user
top -p pid=> display the specific process
top -d 1(number)=> delay updates in minutes top command